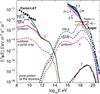
Fig. 4
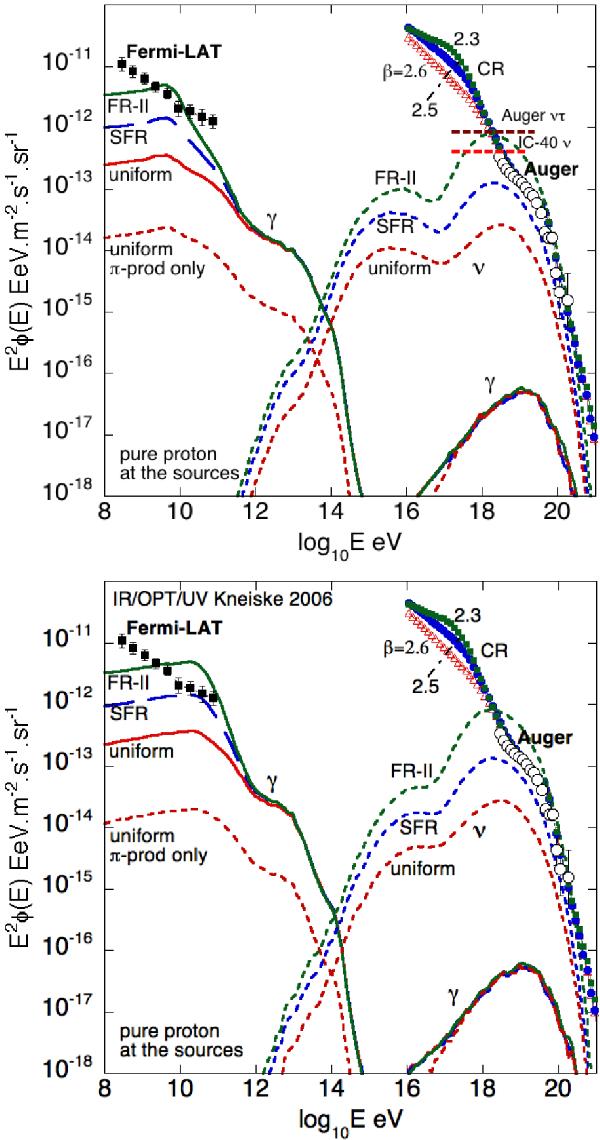
Cosmic ray (markers), neutrino (dashed lines) and photon (solid lines) spectra (E2 × dN/dE) for the dip model compared to Auger spectrum (Abraham et al. 2010a,b; open circles) and the Fermi diffuse gamma-ray spectrum (Abdo et al. 2010; black squares). The contribution of the pion mechanism to the photon spectrum is shown (dashed lines). The chosen spectral indices are β = 2.6 for the uniform case (no evolution), 2.5 for SFR and 2.3 for FR-II. The results were computed assuming the IR/Opt/UV background estimate from Stecker et al. 2006 (top) and Kneiske et al. 2004 (bottom). In the top panel the Auger 90% C.L integrated upper limit (2 years) for tau neutrinos assuming a pure E-2 neutrino spectrum is also shown for comparison (Abraham et al. 2011; the line represents the central value and was multiplied by 3 assuming a complete mixing of the neutrino flavors). The equivalent IceCube limit (IC-40, red thick-dashed line) is also shown (Abbasi et al. 2011).
Current usage metrics show cumulative count of Article Views (full-text article views including HTML views, PDF and ePub downloads, according to the available data) and Abstracts Views on Vision4Press platform.
Data correspond to usage on the plateform after 2015. The current usage metrics is available 48-96 hours after online publication and is updated daily on week days.
Initial download of the metrics may take a while.