Fig. 7
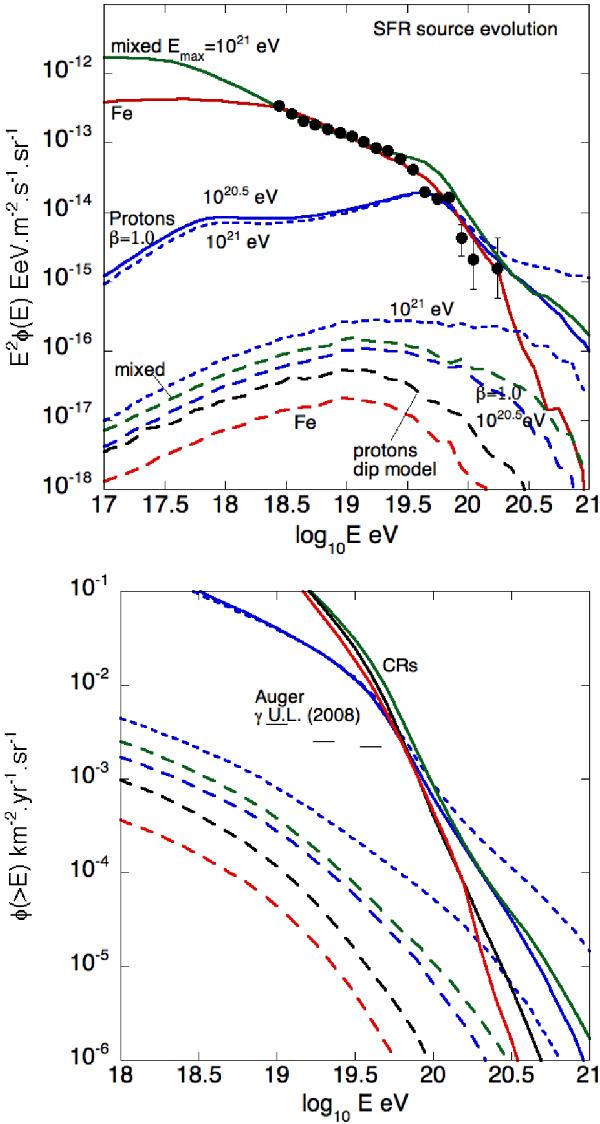
Top: cosmic ray (solid lines), and photon (dashed lines) spectra (E2 × dN/dE) compared to Auger spectrum for different models assuming a SFR source evolution: dip model, β = 2.5, Emax = 1020.5 eV; late-transition model, β = 1.0, Emax = 1020.5 eV and 1021 eV (short dashed lines); mixed composition, β = 2.1, Emax = 1021 eV; pure iron, β = 2.0, Emax = 1020.5 eV. Bottom: integrated flux for the same models. Upper limits on the UHE photon flux from the Pierre Auger Observatory are also displayed (Abraham et al. 2008).
Current usage metrics show cumulative count of Article Views (full-text article views including HTML views, PDF and ePub downloads, according to the available data) and Abstracts Views on Vision4Press platform.
Data correspond to usage on the plateform after 2015. The current usage metrics is available 48-96 hours after online publication and is updated daily on week days.
Initial download of the metrics may take a while.