Fig.2
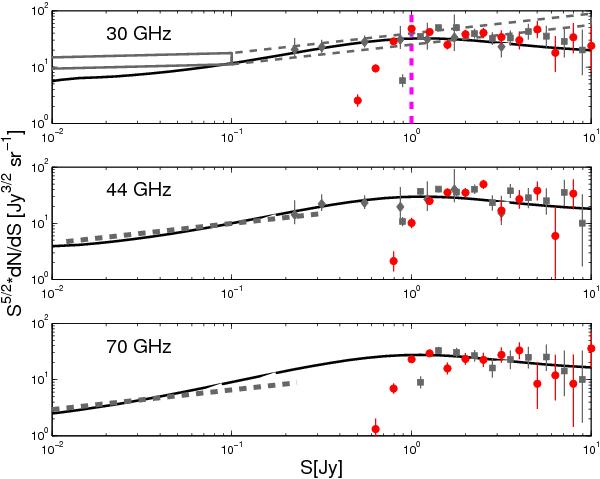
Euclidean normalized differential number counts at the LFI frequencies. The red circles with Poisson error bars show the counts of sources with counterparts in our reference 30 GHz sample. In each panel, the solid curves show the total number counts of extragalactic radio sources predicted by the de Zotti et al. (2005) model. Also shown are: the counts estimated at 31 GHz from DASI (grey dashed box; Kovac et al. 2002) and at 33 GHz from the VSA data (grey box; Cleary et al. 2005); the counts from the PACO (grey diamonds; Bonavera et al. 2011) and the WMAP 5-yr surveys (grey squares; Massardi et al. 2009), at the closest frequencies, and the counts estimated by Waldram et al. (2007) (grey dashed line), exploiting multi-frequency follow-up observations of the 15 GHz 9C sources. The vertical dashed magenta line in the upper panel indicates the flux density completeness limit, 1.0Jy, estimated for our primary sample Sect. 2.3.
Current usage metrics show cumulative count of Article Views (full-text article views including HTML views, PDF and ePub downloads, according to the available data) and Abstracts Views on Vision4Press platform.
Data correspond to usage on the plateform after 2015. The current usage metrics is available 48-96 hours after online publication and is updated daily on week days.
Initial download of the metrics may take a while.