Fig. 12
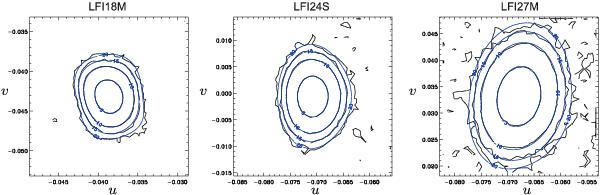
Examples (one per frequency channel) of the LFI measured beams compared with simulations. The simulated main beams have been computed in the co- and cross-polar basis according to Ludwig’s third definition (Ludwig 1973), in spherical grids with 301 × 301 points defined with respect to the LOS frame. They are referred to the design telescope configuration. In each plot the contours are the levels at − 3, − 10, − 15, and − 20dB from the corresponding power peak. The simulations have been carried out in the transmitting mode using GRASP9 software. Physical optics and physical theory of diffraction have been used on both reflectors.
Current usage metrics show cumulative count of Article Views (full-text article views including HTML views, PDF and ePub downloads, according to the available data) and Abstracts Views on Vision4Press platform.
Data correspond to usage on the plateform after 2015. The current usage metrics is available 48-96 hours after online publication and is updated daily on week days.
Initial download of the metrics may take a while.