Fig. 15
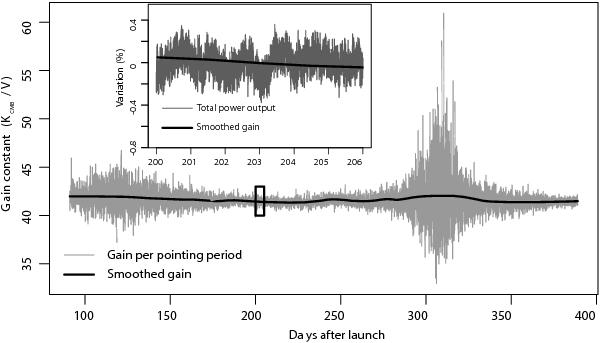
Reconstructed gain for radiometer LFI21M. Thin gray line: gain constants obtained for each pointing period by the iterative calibration procedure. The two regions showing large scatter in the reconstructed gain correspond to periods with minimum amplitude in the CMB dipole. Thick black line: gain constants obtained after smoothing – this is the actual curve used in the pipeline. The inset shows a closer look at the region between Operational Days 200 and 205. Here the relative variation for the smoothed gain model is compared with the relative gain variation calculated from Eq. (16).
Current usage metrics show cumulative count of Article Views (full-text article views including HTML views, PDF and ePub downloads, according to the available data) and Abstracts Views on Vision4Press platform.
Data correspond to usage on the plateform after 2015. The current usage metrics is available 48-96 hours after online publication and is updated daily on week days.
Initial download of the metrics may take a while.