Fig. 23
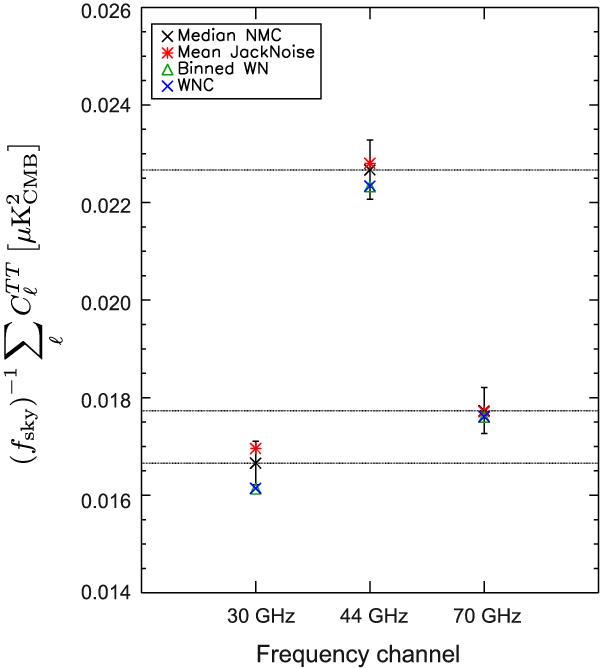
Comparison of noise estimates from different methods. Black: noise from high-ℓ means of noise Monte Carlo statistics. Red: noise from the high-ℓ mean of the jackknife noise map pseudo-Cℓ spectra. Green: noise from the binned white noise Monte Carlo maps. Blue: noise from white noise covariance matrices. Error bars are relative to values from Monte Carlo simulations. We have weighted all the values with the inverse of the analysed sky fraction,  , to represent the noise levels of temperature Cℓ spectra that would result from using full sky maps.
Current usage metrics show cumulative count of Article Views (full-text article views including HTML views, PDF and ePub downloads, according to the available data) and Abstracts Views on Vision4Press platform.
Data correspond to usage on the plateform after 2015. The current usage metrics is available 48-96 hours after online publication and is updated daily on week days.
Initial download of the metrics may take a while.