Free Access
Fig. 4
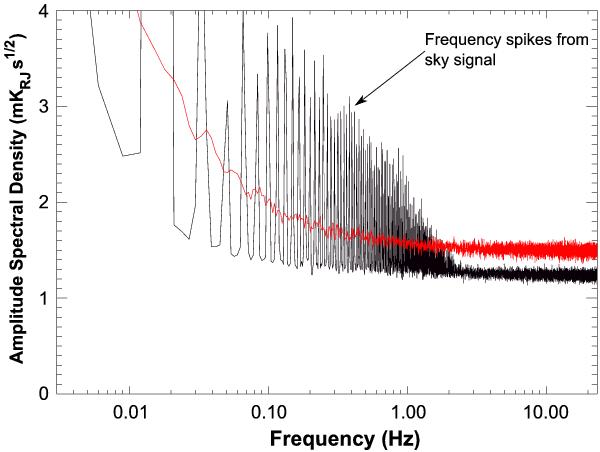
Amplitude spectral density for weighted sum (black) and weighted difference (red) of LFI28M radiometer diodes. A white noise component that is anti-correlated between the two timestreams accounts for the difference in white noise level seen in the plot. Further analysis steps use the weighed sum data.
Current usage metrics show cumulative count of Article Views (full-text article views including HTML views, PDF and ePub downloads, according to the available data) and Abstracts Views on Vision4Press platform.
Data correspond to usage on the plateform after 2015. The current usage metrics is available 48-96 hours after online publication and is updated daily on week days.
Initial download of the metrics may take a while.