Free Access
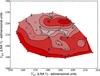
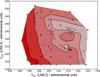
Fig. 6
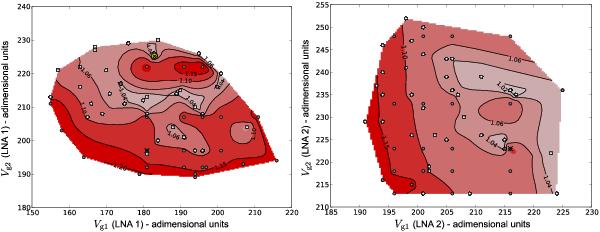
Example of condensed noise temperature maps for the two LNAs of radiometer LFI21S. Contour values represent the ratio of the noise temperature in a given bias configuration to the minimum noise temperature found in all tested configurations. The yellow crossed point is the chosen bias point.
This figure is made of several images, please see below:
Current usage metrics show cumulative count of Article Views (full-text article views including HTML views, PDF and ePub downloads, according to the available data) and Abstracts Views on Vision4Press platform.
Data correspond to usage on the plateform after 2015. The current usage metrics is available 48-96 hours after online publication and is updated daily on week days.
Initial download of the metrics may take a while.