Fig. 2
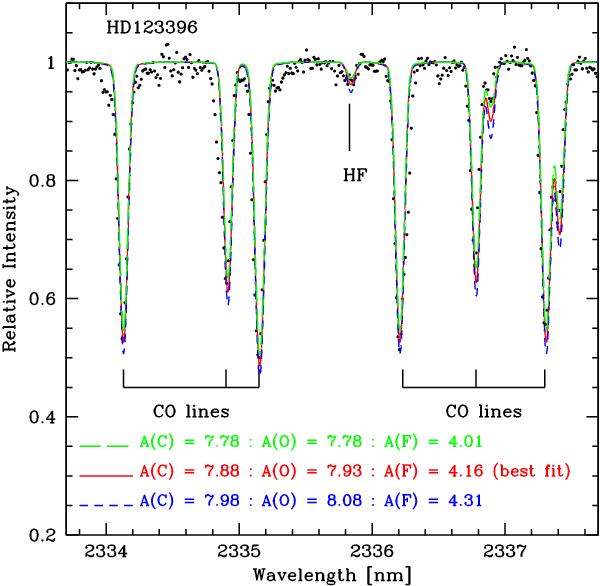
Observed (points) and synthetic (line) spectra of HD 123396 for a sample of the wavelength regions in the K band. The abundances derived for C, O, and F are labelled in the figure. The synthetic spectra stand for the best fit (solid line) and unsatisfactory ones (short and long dash lines) by varying the abundances of C by ± 0.10 dex, and O and F by ± 0.15 dex, respectively (refer to the text).
Current usage metrics show cumulative count of Article Views (full-text article views including HTML views, PDF and ePub downloads, according to the available data) and Abstracts Views on Vision4Press platform.
Data correspond to usage on the plateform after 2015. The current usage metrics is available 48-96 hours after online publication and is updated daily on week days.
Initial download of the metrics may take a while.