Free Access
Fig. 2
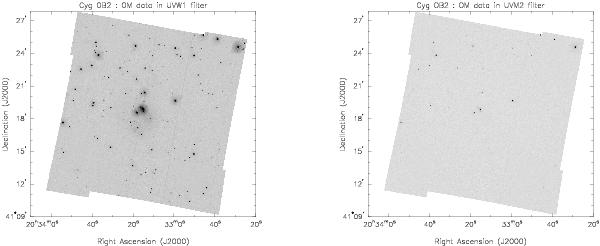
Mosaic image of the core of Cyg OB2 as seen with the Optical Monitor through the UVW1 (left) and UVM2 (right) filters during observation 5. The impact of the interstellar reddening on the number of sources detected in the UVM2 band is clearly seen.
Current usage metrics show cumulative count of Article Views (full-text article views including HTML views, PDF and ePub downloads, according to the available data) and Abstracts Views on Vision4Press platform.
Data correspond to usage on the plateform after 2015. The current usage metrics is available 48-96 hours after online publication and is updated daily on week days.
Initial download of the metrics may take a while.