Fig. 7
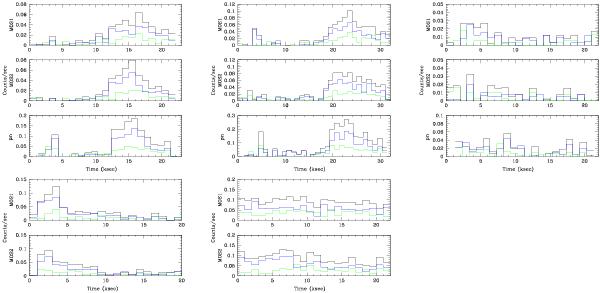
EPIC light curves of variable sources illustrating the variety of behaviours that are observed. The green, blue, and black histograms yield the background-subtracted light curves in the medium, hard, and total energy band respectively. The time is given in ks from the start of the corresponding observation. Top, from left to right: sources 39, 132, and 190 during observations 4, 6, and 2, respectively. Bottom, from left to right: sources 67 and 176 during observations 1 and 2, respectively.
Current usage metrics show cumulative count of Article Views (full-text article views including HTML views, PDF and ePub downloads, according to the available data) and Abstracts Views on Vision4Press platform.
Data correspond to usage on the plateform after 2015. The current usage metrics is available 48-96 hours after online publication and is updated daily on week days.
Initial download of the metrics may take a while.