Fig. 8
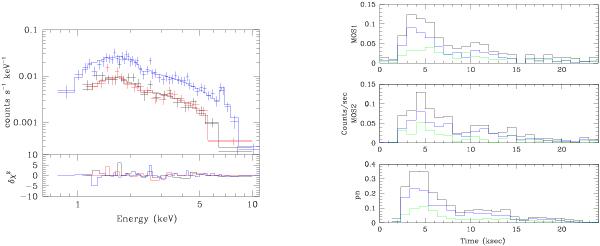
Left: EPIC spectra (along with the best-fit model) of source 34 during the third observation. Right: EPIC light curves of this source during the same observation. The green, blue, and black histograms indicate the light curves in the medium, hard, and total energy bands, respectively. The time is given in ks elapsed from the start of the third observation.
Current usage metrics show cumulative count of Article Views (full-text article views including HTML views, PDF and ePub downloads, according to the available data) and Abstracts Views on Vision4Press platform.
Data correspond to usage on the plateform after 2015. The current usage metrics is available 48-96 hours after online publication and is updated daily on week days.
Initial download of the metrics may take a while.