Fig. 9
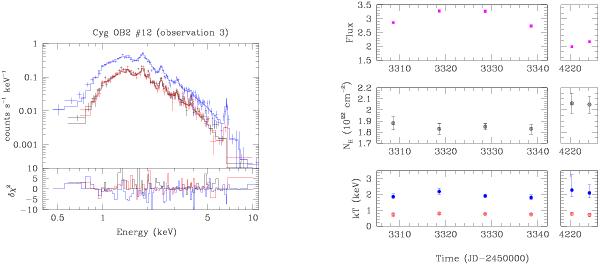
Left: EPIC spectra (along with the best-fit model) of Cyg OB2 #12 as observed during the third observation. Right: best-fit parameters of the EPIC spectra of Cyg OB2 #12. The top panel illustrates the observed flux (in units 10-12 erg cm-2 s-1) over the 0.5 − 10 keV energy range. The middle panel yields the column density towards the X-ray emitting plasma, whilst the bottom panel displays the two temperatures of the emission components.
Current usage metrics show cumulative count of Article Views (full-text article views including HTML views, PDF and ePub downloads, according to the available data) and Abstracts Views on Vision4Press platform.
Data correspond to usage on the plateform after 2015. The current usage metrics is available 48-96 hours after online publication and is updated daily on week days.
Initial download of the metrics may take a while.