Free Access
Fig. 1
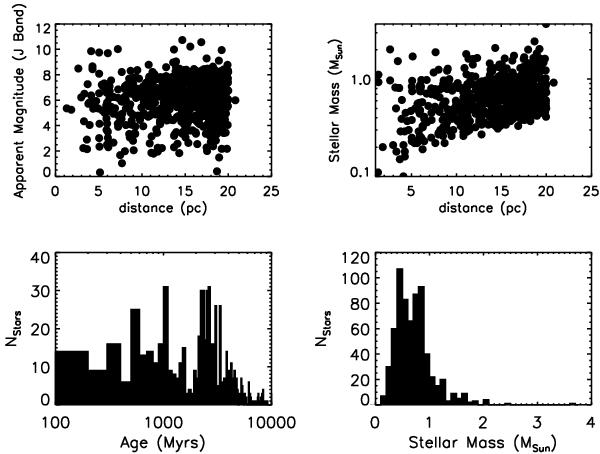
Principal characteristics of the sample of nearby stars used to built the example synthetic population. Upper left: apparent magnitude in the J band vs. distance in pc. Upper right: stellar mass (M⊙) vs. distance in pc. Lower left: histogram of stellar ages (Myrs). Lower right: histogram of stellar masses (M⊙).
Current usage metrics show cumulative count of Article Views (full-text article views including HTML views, PDF and ePub downloads, according to the available data) and Abstracts Views on Vision4Press platform.
Data correspond to usage on the plateform after 2015. The current usage metrics is available 48-96 hours after online publication and is updated daily on week days.
Initial download of the metrics may take a while.