Fig. 11
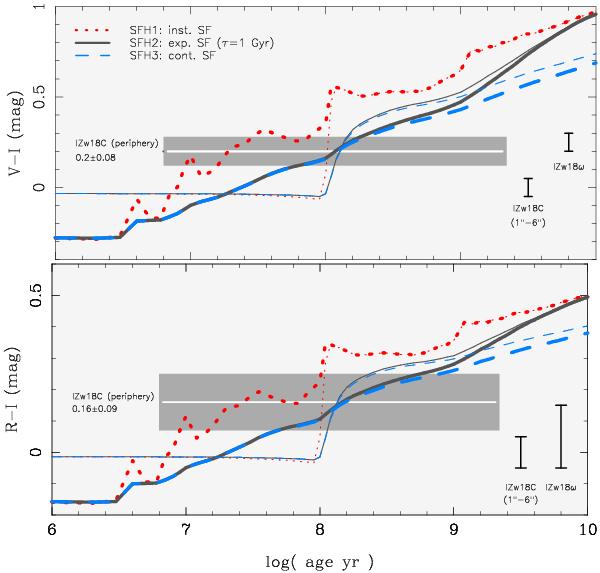
Comparison of the V − I and R − I colors of I Zw 18 C and of region ω in I Zw 18 with model predictions for a stellar population forming instantaneously (SFH1: thick dotted curve) or continuously, with an exponentially decreasing or constant star formation rate (SFH2 and SFH3: thick solid and dashed lines, respectively). The models have been computed with Pegase 2.0 (Fioc & Rocca-Volmerange 1997) for a constant metallicity (Z = 0.001) and a Salpeter initial mass function between 0.1 and 100 M⊙, and do not include nebular emission. Thin curves correspond to the same star formation histories but assume an IMF truncated above 5 M⊙. The vertical bars labeled I Zw 18ω depict the range between the mean and reddest color in region ω of I Zw 18 (V − I = 0.2 ...0.3 and R − I = –0.06 ...0.15). Bars labeled I Zw 18 C (1′′–6′′) indicate the mean color of I Zw 18 C in the radius range 1′′ ≤ R⋆ ≤ 6′′ ( ≈ 0 ± 0.05 mag). The mean colors and their 1σ uncertainties in the extreme periphery (R⋆ ≥ 6′′) of I Zw 18 C at μ ≳ 27.6 mag/◻″ are depicted by the rectangular areas.
Current usage metrics show cumulative count of Article Views (full-text article views including HTML views, PDF and ePub downloads, according to the available data) and Abstracts Views on Vision4Press platform.
Data correspond to usage on the plateform after 2015. The current usage metrics is available 48-96 hours after online publication and is updated daily on week days.
Initial download of the metrics may take a while.