Fig. 13
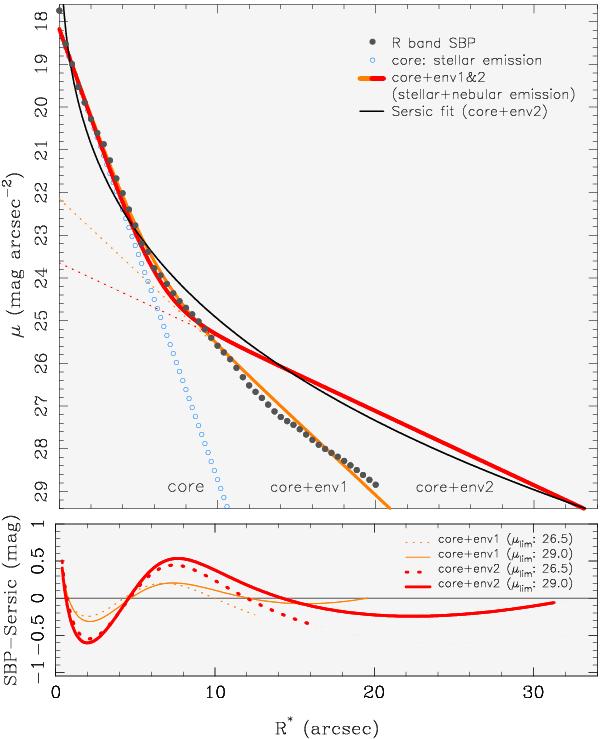
Upper panel: comparison of the R SBP of I Zw 18 (filled circles), with a synthetic SBP (labeled core+env1) that is due to the superposition of two exponential components of differing central surface brightness μ0 and exponential scale length α. The first one, labeled core (open circles) approximates the stellar component that is confined to and dominates within the inner (R⋆ ≤ 6′′) HSB part of the observed SBP. The second component (env1; dotted line intersecting the abscisca at μ ~ 22 mag/◻″) is a linear fit to the nebular LSB envelope. A Sérsic model to the composite core+env1 SBP (orange solid-line curve) yields a Sérsic exponent η ≈ 2, close to the best-fitting value of η ≈ 2.2 for the observed SBP. The synthetic SBP labeled core+env2 (red solid-line curve) is computed by superposing on the core an exponential nebular envelope of equal luminosity but twice as large α as the observed envelope env1. A Sérsic fit to core+env2 (thin curve) yields an η ≈ 5. Lower panel: residuals between the synthetic SBPs core+env1 (thin curve) and core+env2 (thick curve) and their Sérsic fits when the latter are computed down to a surface brightness level μlim of 26.5 and 29 mag/◻″ (solid and dotted curves, respectively).
Current usage metrics show cumulative count of Article Views (full-text article views including HTML views, PDF and ePub downloads, according to the available data) and Abstracts Views on Vision4Press platform.
Data correspond to usage on the plateform after 2015. The current usage metrics is available 48-96 hours after online publication and is updated daily on week days.
Initial download of the metrics may take a while.