Fig. 14
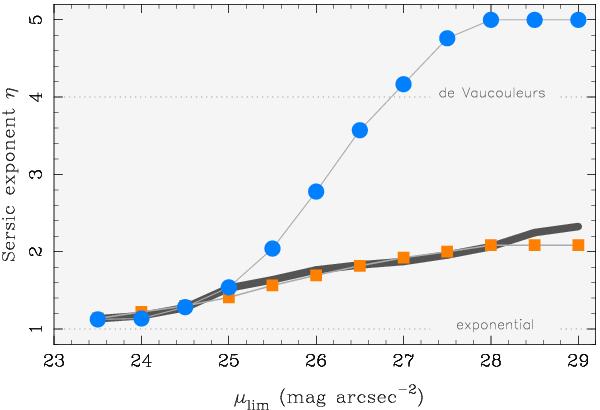
Best-fitting Sérsic exponent η vs. μlim for the SBPs in Fig. 13. The thick-gray curve and the filled squares show, respectively, the variation in η for the observed R band SBP of I Zw 18 and the two-component approximation to it, labeled core+env1. The variation in η with μeff for the synthetic SBP core+env2 is shown with filled circles.
Current usage metrics show cumulative count of Article Views (full-text article views including HTML views, PDF and ePub downloads, according to the available data) and Abstracts Views on Vision4Press platform.
Data correspond to usage on the plateform after 2015. The current usage metrics is available 48-96 hours after online publication and is updated daily on week days.
Initial download of the metrics may take a while.