Fig. 3
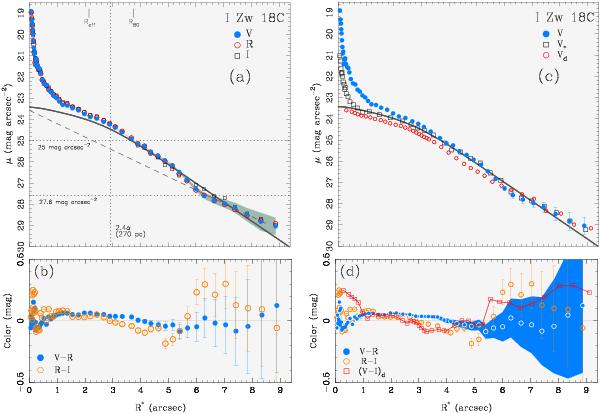
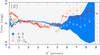
a) Surface brightness profiles (SBPs) of I Zw 18 C in V (F555W), R (F606W) and I (F814W). The thick gray curve shows a fit to the V SBP for R⋆ ≥ 3 8 with the modified exponential fitting function Eq. (1) (modexp) for a core radius Rc = 2.4·α (dotted vertical line). The effective radius Reff and the radius R80 enclosing 80% of the total V emission are indicated. The dashed line shows a linear fit to the outermost exponential part of the V SBP for R⋆ ≥ 6′′, i.e. at the extremely faint (μ ≥ 27.6 mag/◻″) outskirts of the galaxy. The shadowed area corresponds to the 1σ uncertainties of the V SBP. b) Radial V − R and R − I color profiles of I Zw 18 C, derived from the SBPs in the upper panel. c) Comparison of the best-fitting modexp model in panel a) (thick gray curve) with the V SBPs of I Zw 18 C after partial removal of the brightest point sources (V ⋆ ; squares). Open circles show the SBP of the unresolved stellar emission (Vd), computed after complete removal of compact ( ≤ 05) sources with an unsharp masking technique. d) Comparison of the color profiles in panel b) (open and filled circles) with the (V − I)d color profile (squares) of the unresolved stellar emission. The shadowed area depicts the 1σ uncertainties of the V − R profile.
Current usage metrics show cumulative count of Article Views (full-text article views including HTML views, PDF and ePub downloads, according to the available data) and Abstracts Views on Vision4Press platform.
Data correspond to usage on the plateform after 2015. The current usage metrics is available 48-96 hours after online publication and is updated daily on week days.
Initial download of the metrics may take a while.