Fig. 5
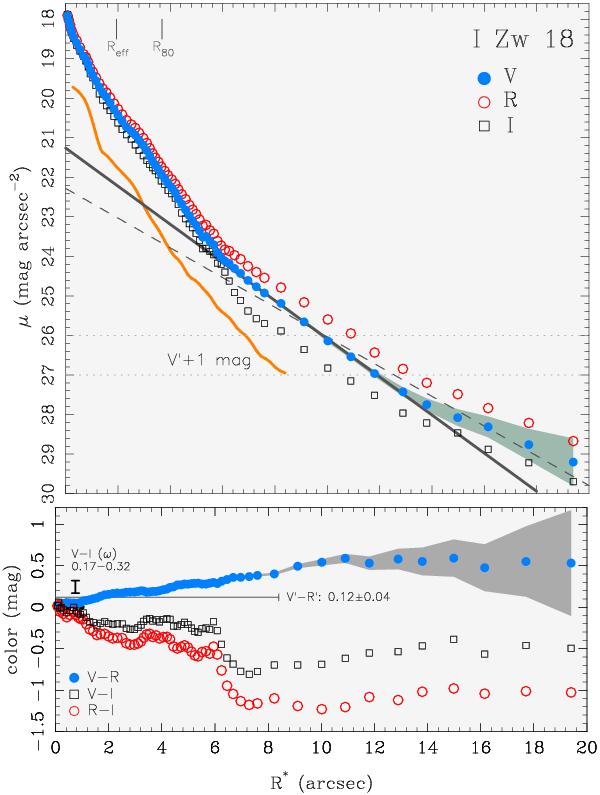
(upper panel) V, R, and I SBPs of I Zw 18. The thick-solid and thin-dashed lines show linear fits to the V SBP in the radius range 7′′ ≤ R⋆ ≤ 15′′ and R⋆ ≥ 7′′, respectively. The effective radius Reff and the radius R80 enclosing 80% of the total V emission are indicated. The V SBP derived by P02 after subtraction of the Hβ and [Oiii]λλ4959, 5007 emission lines (referred to as V′), shifted by +1 mag for the sake of clarity, is included for comparison. (lower panel) V − R (filled circles), V − I (squares), and R − I (open circles) color profiles, computed from the SBPs in the upper panel. The vertical bar indicates the V − I color range inferred by P02 from ground-based and HST PC data for region ω at the southeastern tip of I Zw 18 (V − I(ω) = 0.17 ...0.32 mag). The mean V − R color of I Zw 18’s host after subtraction of nebular line emission (V′ – R′ = 0.12 ± 0.04 mag; P02) is indicated by the horizontal line. The colors V − I(ω) and V′ – R′ of the stellar host galaxy are by, respectively, ≳ 0.8 mag redder and ≈ 0.4 mag bluer than the colors of the exponential nebular envelope (R⋆ ≥ 6′′).
Current usage metrics show cumulative count of Article Views (full-text article views including HTML views, PDF and ePub downloads, according to the available data) and Abstracts Views on Vision4Press platform.
Data correspond to usage on the plateform after 2015. The current usage metrics is available 48-96 hours after online publication and is updated daily on week days.
Initial download of the metrics may take a while.