Fig. 6
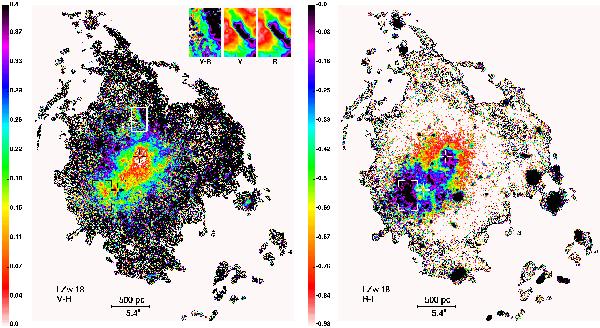
V − R (left panel) and R − I (right panel) color map of I Zw 18, displayed in the range between 0 and 0.4 mag and –0.9 and 0 mag, respectively. Crosses mark the SF regions NW and SE. The region termed ω by P02 (cf. Fig. 1) is indicated at the southeastern part of the image. The insets in the left panel show a magnified view of a shell ≈ 5′′ northward of region NW.
Current usage metrics show cumulative count of Article Views (full-text article views including HTML views, PDF and ePub downloads, according to the available data) and Abstracts Views on Vision4Press platform.
Data correspond to usage on the plateform after 2015. The current usage metrics is available 48-96 hours after online publication and is updated daily on week days.
Initial download of the metrics may take a while.