Fig. 8
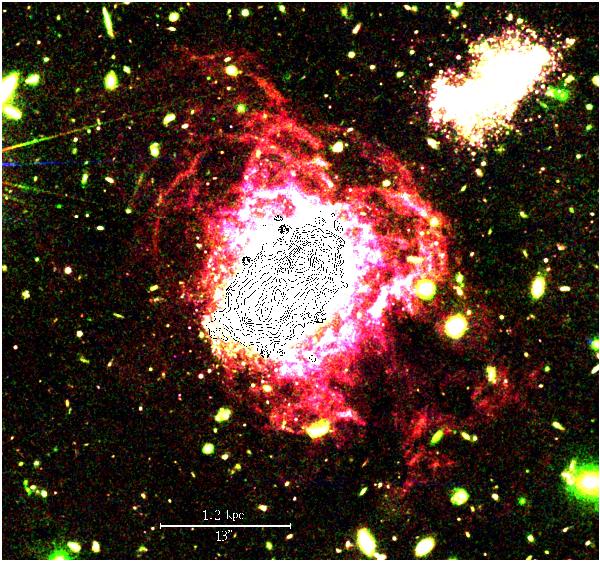
Composite image of I Zw 18 and I Zw 18 C with the R, I, and V bands shown in the red, green, and blue channels, respectively. The contours, adapted from P02, are computed from HST WFPC2 R data, after 2D subtraction of the Hα emission (referred to as R′), they thus delineate the morphology of the stellar and nebular continuum emission in the main body of I Zw 18. Contours go from 19 to 25 R′ in steps of 0.5 mag.
Current usage metrics show cumulative count of Article Views (full-text article views including HTML views, PDF and ePub downloads, according to the available data) and Abstracts Views on Vision4Press platform.
Data correspond to usage on the plateform after 2015. The current usage metrics is available 48-96 hours after online publication and is updated daily on week days.
Initial download of the metrics may take a while.