Fig. 10
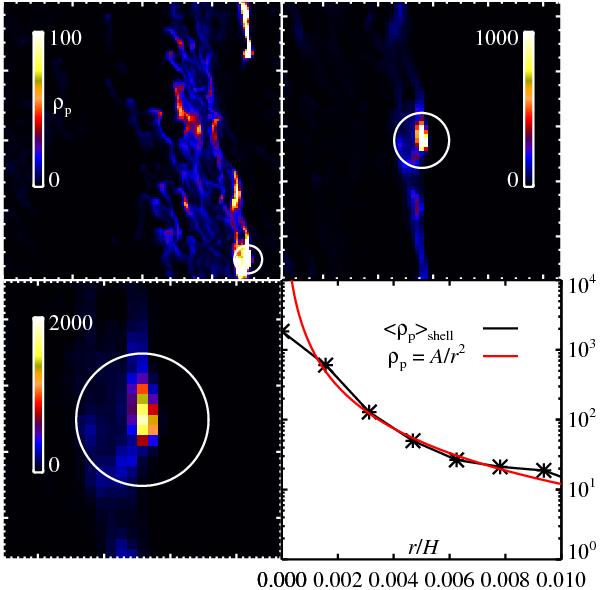
Zoom in on the densest grid cell in SI128_e0.3_NS at t = 32Torb. The overdense particle structure is elongated along the shear direction with a density decreasing in all directions from the densest point. The lower-right panel shows the particle density average over shells of thickness one grid cell and a 1/r2 power-law overplotted.
Current usage metrics show cumulative count of Article Views (full-text article views including HTML views, PDF and ePub downloads, according to the available data) and Abstracts Views on Vision4Press platform.
Data correspond to usage on the plateform after 2015. The current usage metrics is available 48-96 hours after online publication and is updated daily on week days.
Initial download of the metrics may take a while.