Fig. 13
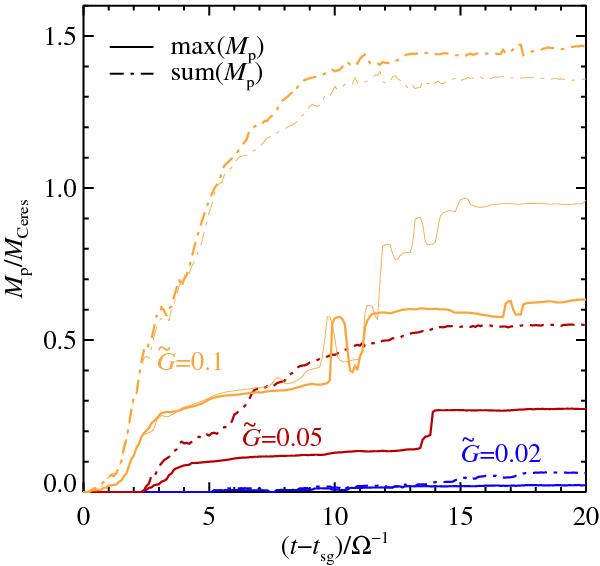
Evolution of maximum planetesimal mass (full line) and total mass in planetesimals (dash-dotted line) for 1283 simulations with inelastic NS collisions (thin yellow line shows the  simulation without collisions for comparison). Colors indicate
  . Extended wiggles in the curve arise during clump merging. The total particle mass in the box is 2.8, 1.4 and 0.56 Ceres masses, in order of decreasing
  .
.
Current usage metrics show cumulative count of Article Views (full-text article views including HTML views, PDF and ePub downloads, according to the available data) and Abstracts Views on Vision4Press platform.
Data correspond to usage on the plateform after 2015. The current usage metrics is available 48-96 hours after online publication and is updated daily on week days.
Initial download of the metrics may take a while.