Fig. 8
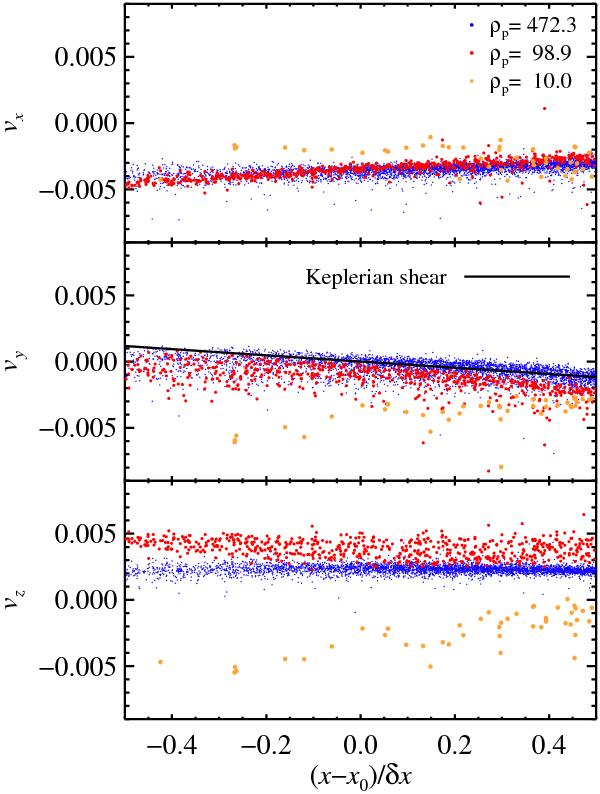
The three components of the particle velocity as a function of the radial position within a grid cell. Three grid cells were chosen at t = 45Torb of the run SI128_e0.3, one with the highest particle density in the box, one with a particle density close to 100 times the gas density and finally one with a particle density close to 10 times the gas density. Both systematic and random particle motion is present within the grid cells. The Keplerian shear is clearly visible in the y-velocity (marked with a solid line in the middle panel). The cells with the highest density have generally a slower random motion and are thus more affected by the Keplerian shear.
Current usage metrics show cumulative count of Article Views (full-text article views including HTML views, PDF and ePub downloads, according to the available data) and Abstracts Views on Vision4Press platform.
Data correspond to usage on the plateform after 2015. The current usage metrics is available 48-96 hours after online publication and is updated daily on week days.
Initial download of the metrics may take a while.