Fig. 3
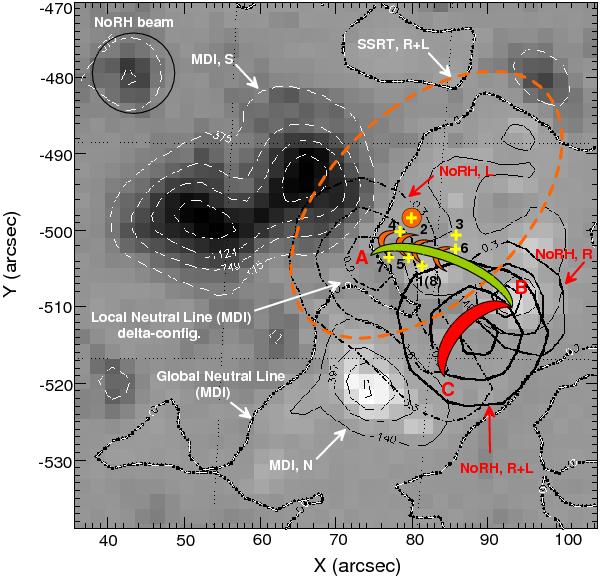
The positions of radio sources at 5.7 GHz (SSRT) and 17 GHz (NoRH) superimposed on the MDI magnetogram. The orange dashed line indicates the position of the left polarized local source at 5.7 GHz at 02:17:54.8 UT. The dash-and-dot line shows the position of the left polarized background source of the burst at 17 GHz (extended southwestward) at 02:13:00 UT. The straight yellow crosses are the positions of spike sources 1–8 corresponding ones in Fig. 2.
Current usage metrics show cumulative count of Article Views (full-text article views including HTML views, PDF and ePub downloads, according to the available data) and Abstracts Views on Vision4Press platform.
Data correspond to usage on the plateform after 2015. The current usage metrics is available 48-96 hours after online publication and is updated daily on week days.
Initial download of the metrics may take a while.