Free Access
Fig. 5
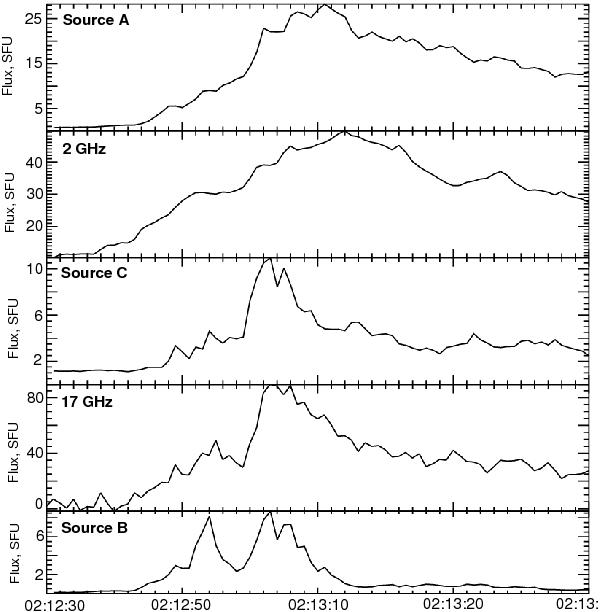
The comparison of the time profiles of the individual sources A, B, C at 17 GHz with integral spectra. It is obvious that the source A emission profile is close to the integral emission profile at 2 GHz; source C, to that at 17 GHz. The intensity scale is in solar flux units (SFU).
Current usage metrics show cumulative count of Article Views (full-text article views including HTML views, PDF and ePub downloads, according to the available data) and Abstracts Views on Vision4Press platform.
Data correspond to usage on the plateform after 2015. The current usage metrics is available 48-96 hours after online publication and is updated daily on week days.
Initial download of the metrics may take a while.