Fig. A.1
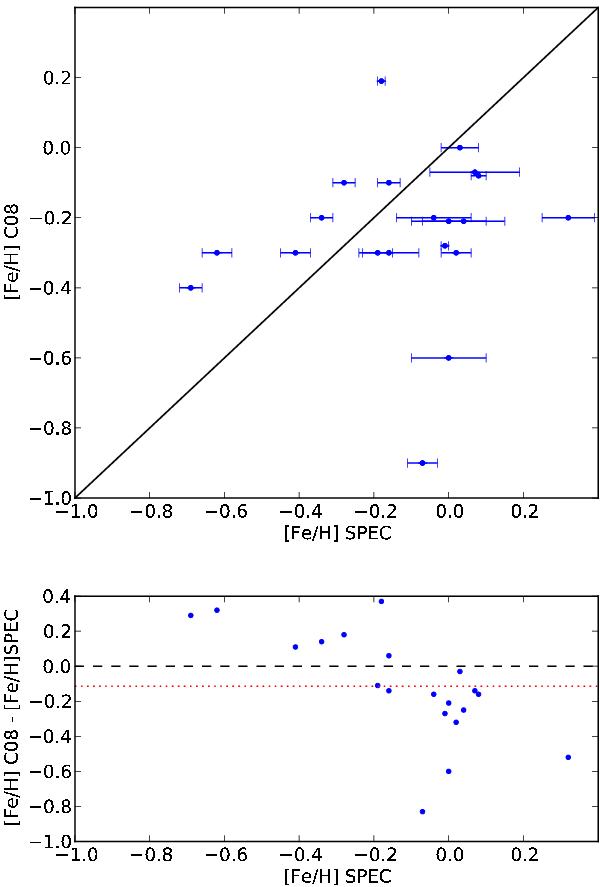
[Fe/H] obtained with the Casagrande et al. (2008) method versus the spectroscopic metallicity. The blue dots with error bars represent the data points. The black line depicts a one-to-one relationship. The metallicity difference between the values of the calibrations and the spectroscopic measurements is shown below each [Fe/H]–[Fe/H] plot. The black dashed line is the zero point of the difference, and the red dotted line represents the average of the metallicity difference.
Current usage metrics show cumulative count of Article Views (full-text article views including HTML views, PDF and ePub downloads, according to the available data) and Abstracts Views on Vision4Press platform.
Data correspond to usage on the plateform after 2015. The current usage metrics is available 48-96 hours after online publication and is updated daily on week days.
Initial download of the metrics may take a while.