Fig. 4
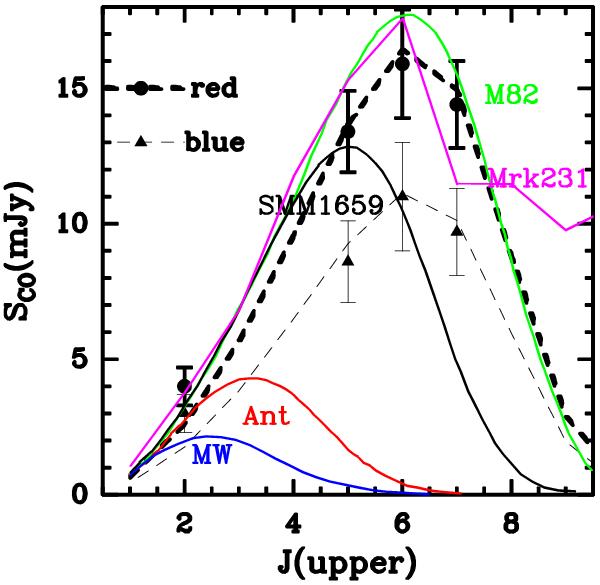
Peak CO line fluxes for the red (dots) and blue component (triangles), with the best LVG model (bold and light dashed lines, respectively) computed with a density nH2 = 3.5 × 103 cm-3, Tk = 45 K, and a column density N(CO) = 1018 cm-2/ km s-1. The light dashed line is related to the bold line in a ratio of 0.8 to 1. The color lines represent CO data from other galaxies (e.g. Weiss et al. 2007; Danielson et al. 2011).
Current usage metrics show cumulative count of Article Views (full-text article views including HTML views, PDF and ePub downloads, according to the available data) and Abstracts Views on Vision4Press platform.
Data correspond to usage on the plateform after 2015. The current usage metrics is available 48-96 hours after online publication and is updated daily on week days.
Initial download of the metrics may take a while.