Fig. 11
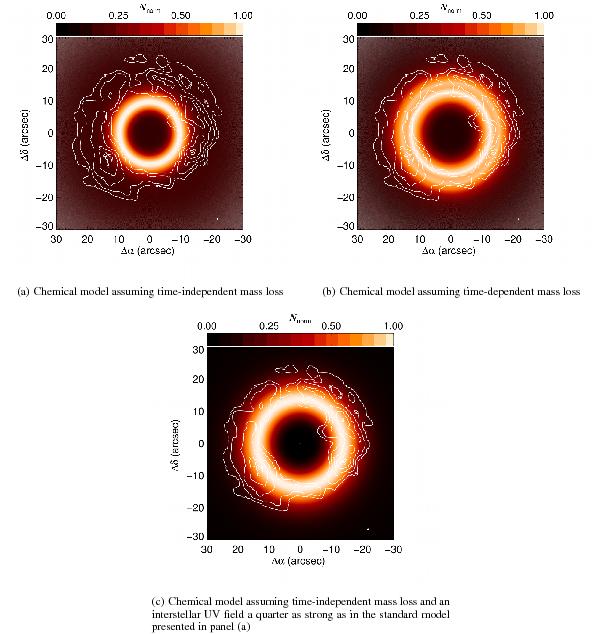
Contours (in white) of the brightness distribution of the C2H N = 1−0 transition measured by Guélin et al. (1999) with PdBI, overlayed on the normalised predicted brightness distribution, assuming LTE conditions. The three panels represent the results obtained with three different chemical models. For the map in panel a), we assumed a constant mass loss, and the interstellar UV field of Draine (1978). The map in panel b) shows the brightness distribution when assuming density enhancements in the CSE as described by Cordiner & Millar (2009) and as discussed in Sect. 4.3.2. For panel c), we assumed again a constant mass loss, but an interstellar UV field that is only 25% as strong as that presented by Draine (1978).
Current usage metrics show cumulative count of Article Views (full-text article views including HTML views, PDF and ePub downloads, according to the available data) and Abstracts Views on Vision4Press platform.
Data correspond to usage on the plateform after 2015. The current usage metrics is available 48-96 hours after online publication and is updated daily on week days.
Initial download of the metrics may take a while.