Fig. 12
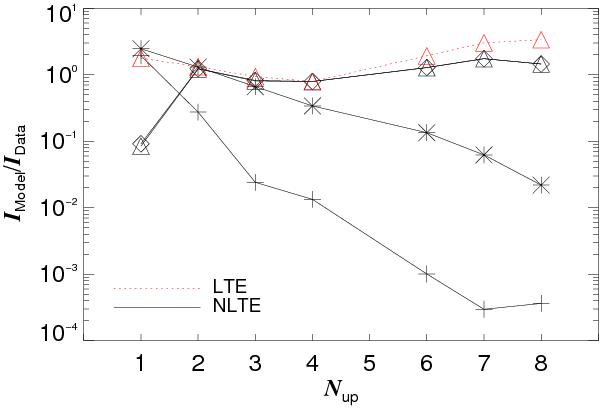
Overview of the ratio IModel/IData of integrated intensities for the C2H lines in Fig. 1. The x-axis is labelled according to the upper N-level of the transition, Nup. Different 1Σ-approximations of the C2H molecule are plotted with different symbols: crosses (+ ) for the model including only the ground state (GS), asterisks (∗ ) for the model including GS and the ν2 state, diamonds (⋄ ) for the model including GS, ν2, and ν3, and triangles (△ ) for the model including the GS and all three vibrationally excited states ν2, ν3, and ν1. Black symbols connected with full lines, and red symbols connected with dotted lines represent NLTE and LTE models, respectively.
Current usage metrics show cumulative count of Article Views (full-text article views including HTML views, PDF and ePub downloads, according to the available data) and Abstracts Views on Vision4Press platform.
Data correspond to usage on the plateform after 2015. The current usage metrics is available 48-96 hours after online publication and is updated daily on week days.
Initial download of the metrics may take a while.