Fig. 13
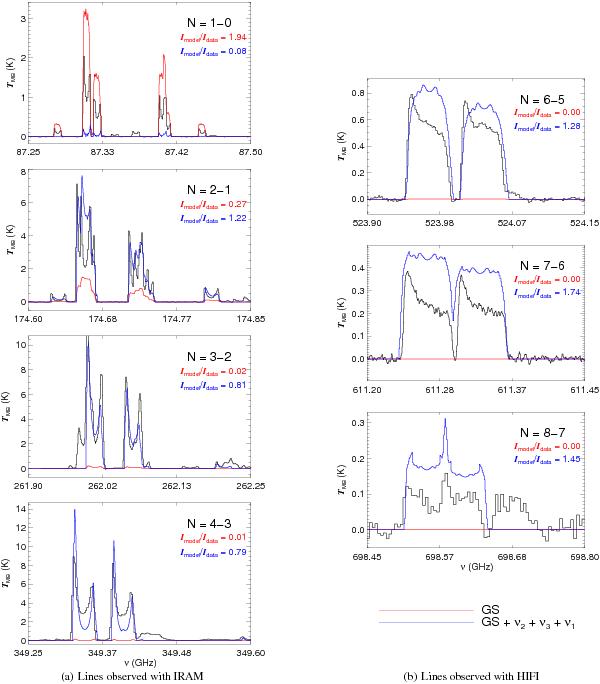
Comparison of the measured C2H spectra (black histograms; see Sect. 2 and Fig. 1 for a description and for the identification of additional spectral features) and GASTRoNOoM model predictions under NLTE conditions for the case where (red) only the ground state is included, and (blue) the ground state, and the three vibrational modes are taken into account. These predictions are based on the “enhanced” abundance profile shown in Fig. 10 and the 1Σ-approximation of C2H. The transition N − (N − 1) and the ratio Imodel/Idata are stated in the upper right corner of each panel, according to the colour code of the plots.
Current usage metrics show cumulative count of Article Views (full-text article views including HTML views, PDF and ePub downloads, according to the available data) and Abstracts Views on Vision4Press platform.
Data correspond to usage on the plateform after 2015. The current usage metrics is available 48-96 hours after online publication and is updated daily on week days.
Initial download of the metrics may take a while.