Fig. 14
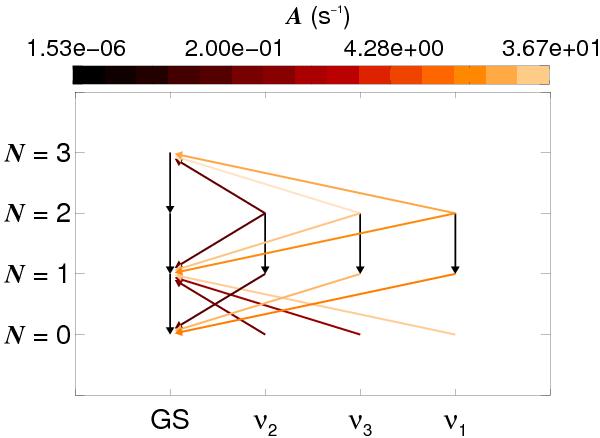
Visualisation of the transitions responsible for the depopulation of the N = 1 level in the vibrational ground state (GS), where vibrational states are indicated on the horizontal axis, and rotational levels N on the vertical axis. The colour of the arrows representing the transitions is indicative of the magnitude of the Einstein-A coefficients of these transitions, as given by the colour bar.
Current usage metrics show cumulative count of Article Views (full-text article views including HTML views, PDF and ePub downloads, according to the available data) and Abstracts Views on Vision4Press platform.
Data correspond to usage on the plateform after 2015. The current usage metrics is available 48-96 hours after online publication and is updated daily on week days.
Initial download of the metrics may take a while.