Free Access
Fig. 4
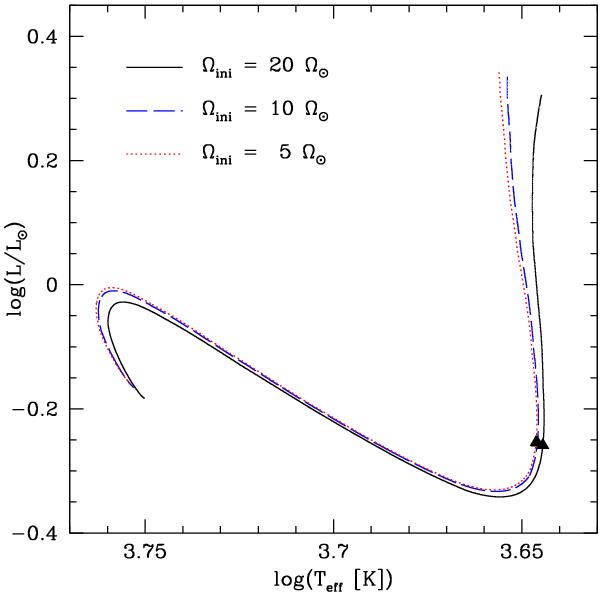
Evolutionary tracks in the HR diagram for rotating PMS models of 1 M⊙. The continuous, dashed, and dotted lines correspond to initial velocities of 20 Ω⊙, 10 Ω⊙, and 5 Ω⊙, respectively. The tracks end when the ZAMS is reached and the end of the disc-locking phase is indicated by a triangle.
Current usage metrics show cumulative count of Article Views (full-text article views including HTML views, PDF and ePub downloads, according to the available data) and Abstracts Views on Vision4Press platform.
Data correspond to usage on the plateform after 2015. The current usage metrics is available 48-96 hours after online publication and is updated daily on week days.
Initial download of the metrics may take a while.