Fig. 19
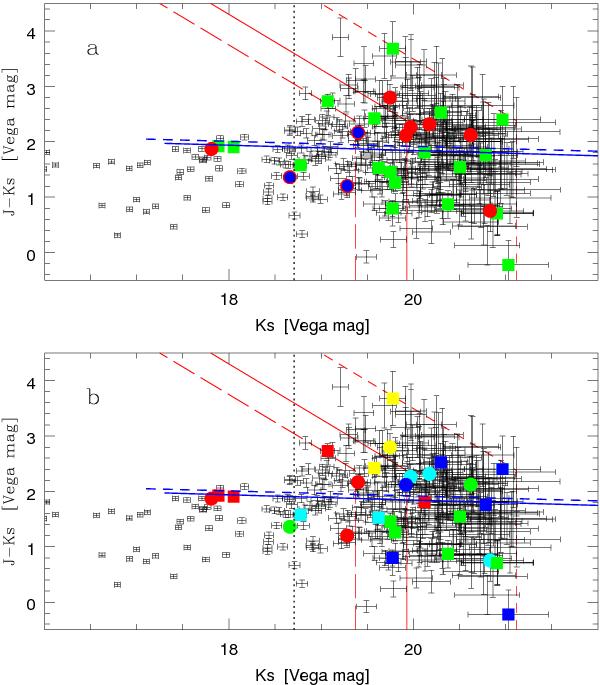
J − Ks vs. Ks colour − magnitude diagram for all GROND sources in the XMMU J0338.7 + 0030 region with flux detections in the z′,J,Ks bands at a significance level ≥ 1σ, whatever the classification of the source by Le Phare (i.e., stars are included). Photometric errors (1σ) are also shown. In each panel, candidate members of XMMU J0338.7+0030 are reproduced according to the corresponding panel of Fig. 15. Here the red short-dashed, solid and long-dashed lines represent the 1σ, 3σ and 5σ flux thresholds in the J,Ks bands. The black vertical dotted and horizontal dotted–long-dashed lines reproduce the characteristic magnitude of the Ks-band luminosity function of cluster galaxies at z ~ 1.2 (Strazzullo et al. 2006) and the J − Ks colour-selection threshold for DRGs (Franx et al. 2003, see text). As a reference, the blue solid and short-dashed lines reproduce the red sequences of the clusters RDCS J1252.9−2927 at z = 1.24 (Lidman et al. 2004) and XMMU J2235.3 − 2557 at z = 1.39 (Lidman et al. 2008), respectively. The candidate members of XMMU J0338.7 + 0030 that are classified as elliptical galaxies (red symbols in panel b)) populate a locus that is broadly consistent with the red sequences of the other two clusters. However, candidate members that are classified as star forming span the same broad range of colours, especially at magnitudes fainter than ~Ks⋆ + 1.
Current usage metrics show cumulative count of Article Views (full-text article views including HTML views, PDF and ePub downloads, according to the available data) and Abstracts Views on Vision4Press platform.
Data correspond to usage on the plateform after 2015. The current usage metrics is available 48-96 hours after online publication and is updated daily on week days.
Initial download of the metrics may take a while.