Free Access
Fig. 3
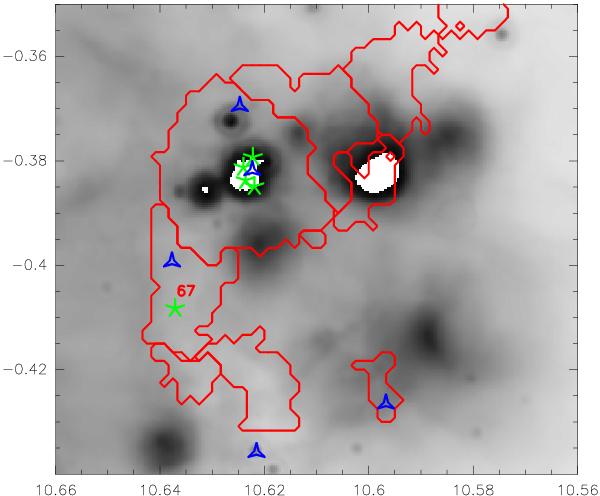
Clump 67 overplotted on a MIPSGAL 24 μm image. The clump definition are the red solid lines. Overplotted green asterisks are Hii regions (Purcell & Hoare 2010), and blue triangles are GLIMPSE Red Sources (Robitaille et al. 2008).
Current usage metrics show cumulative count of Article Views (full-text article views including HTML views, PDF and ePub downloads, according to the available data) and Abstracts Views on Vision4Press platform.
Data correspond to usage on the plateform after 2015. The current usage metrics is available 48-96 hours after online publication and is updated daily on week days.
Initial download of the metrics may take a while.