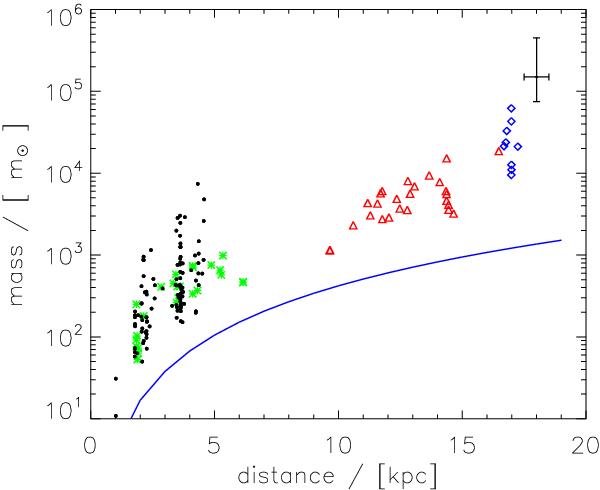
Fig. 8

The mass in solar masses is plotted over the distance in kpc. The solid line indicates the sensitivity/completeness limit of our clump extraction, which depends on the distance. The black filled dots represent sources with IRDC associations, and, therefore, the near distance is plotted. The red triangles represent the far solution of sources without an IRDC for which both a far and a near solution can be calculated; in addition, the green asterisks represent the corresponding near solutions. Blue diamonds show sources with such low velocities that only a single solution can be found in the given direction. The error bar in the top right corner indicates uncertainties of a factor of two for the masses and 0.5 kpc for the distance.
Current usage metrics show cumulative count of Article Views (full-text article views including HTML views, PDF and ePub downloads, according to the available data) and Abstracts Views on Vision4Press platform.
Data correspond to usage on the plateform after 2015. The current usage metrics is available 48-96 hours after online publication and is updated daily on week days.
Initial download of the metrics may take a while.


