Fig. 12
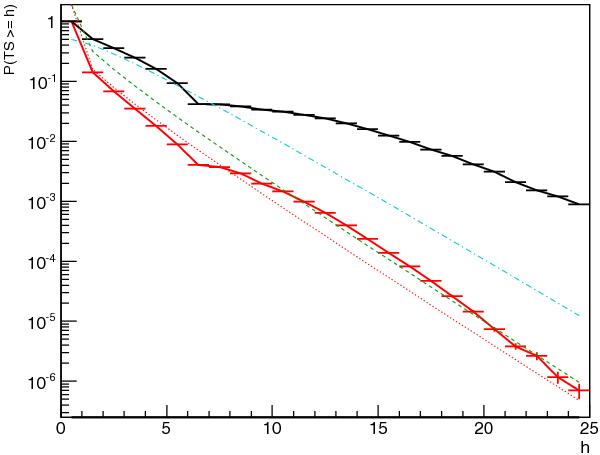
The effect of unmodeled sources. The histograms are the p-value distribution for the Cygnus field when the null hypothesis for Cygnus X-3 is true with the following parameters: Tss = 4, tlcl = 5.99147, flux and position of Cygnus X-3 left free, ggal and giso parameters fixed. The red histogram shows the result when all the simulated sources are included in the models, while the black histogram shows the result when only the source at Cygnus X-3 position is included. The red dotted line is the  theoretical distribution, the green dashed line is the
  theoretical distribution, the cyan dotted-dashed line is the
  distribution.
Current usage metrics show cumulative count of Article Views (full-text article views including HTML views, PDF and ePub downloads, according to the available data) and Abstracts Views on Vision4Press platform.
Data correspond to usage on the plateform after 2015. The current usage metrics is available 48-96 hours after online publication and is updated daily on week days.
Initial download of the metrics may take a while.