Fig. 13
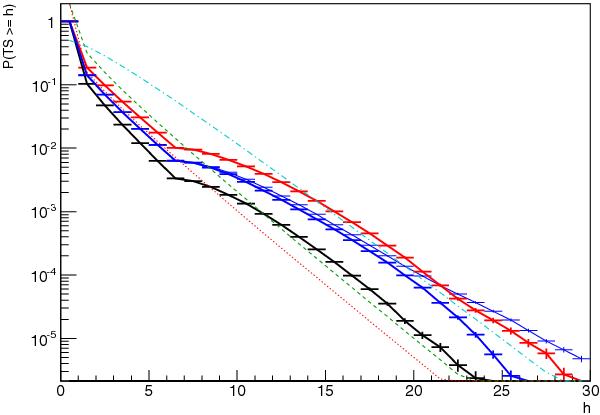
The effect of a poor estimation of the Galactic diffuse emission. The histograms are the p- value distributions for the Cygnus field when the null hypothesis for Cygnus X-3 is true with the following parameters: Tss = 4, tlcl = 5.99147, flux and position of Cygnus X-3 left free. The true value of giso in the simulated data is 7.7, the value of ggal used in the analysis is fixed to 0.67. Blue thin line: simulated ggal = 0.67, giso fixed to 7.7; blue thick line: simulated ggal = 0.67, gisoleft free; red thick line: simulated ggal = 0.67 ∗ 1.1, gisoleft free; black thick line: simulated ggal = 0.67 ∗ 0.89, gisoleft free. The red dotted line is the  theoretical distribution, the green dashed line is the
  theoretical distribution, the cyan dotted-dashed line is the
  distribution.
Current usage metrics show cumulative count of Article Views (full-text article views including HTML views, PDF and ePub downloads, according to the available data) and Abstracts Views on Vision4Press platform.
Data correspond to usage on the plateform after 2015. The current usage metrics is available 48-96 hours after online publication and is updated daily on week days.
Initial download of the metrics may take a while.