Fig. 4
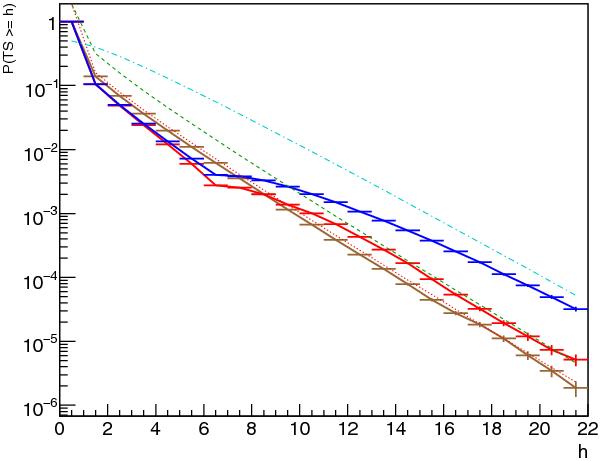
The effect of the hypothesis formulation (trial selection). The p-value distribution depends on the constraint on the position of the source: a comparison of the different analysis methods (in particular, when the position of the source is either kept fixed or allowed to vary in the case of absence of a source at the (l, b) = (160, 0)° location. Histograms are the p-value distribution for an empty Galactic field when the null hypothesis is true. Blue and red histograms have the following parameters: Tss = 4, tlcl = 5.99147, flux and position of the source allowed to vary. The blue histogram contains all trials regardless of the calculated position, while the red histogram contains the trials that respect the ICL criterion. The brown histogram corresponds to the position of the source when it is kept fixed and flux free. The red dotted line is the  theoretical distribution, the green dashed line is the
  theoretical distribution, and the cyan dotted-dashed line is the
  distribution.
Current usage metrics show cumulative count of Article Views (full-text article views including HTML views, PDF and ePub downloads, according to the available data) and Abstracts Views on Vision4Press platform.
Data correspond to usage on the plateform after 2015. The current usage metrics is available 48-96 hours after online publication and is updated daily on week days.
Initial download of the metrics may take a while.