Fig. 9
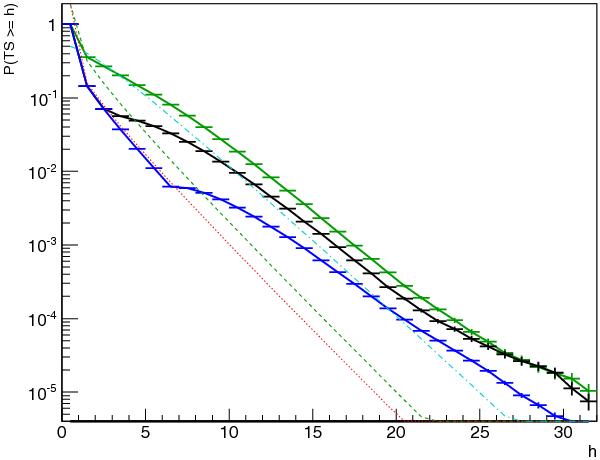
The p-value distributions change as a function of the tlcl parameter. Simulations of the Cygnus region with no source present at Cygnus X-3 position were analyzed for different tlcl values without applying the ICL rejection criterion. The flux and position of the hypothetical source at the Cygnus X-3 were allowed to vary, the ggal and giso parameters were kept fixed, and Tss = 4. Green histogram: tlcl = 0; black histogram: tlcl = 2.29575 (corresponds to a 68% confidence level for two degrees of freedom); blue histogram: tlcl = 5.99147. The red dotted line is the  theoretical distribution, the green dashed line is the
  theoretical distribution, and the cyan dotted-dashed line is the
  distribution.
Current usage metrics show cumulative count of Article Views (full-text article views including HTML views, PDF and ePub downloads, according to the available data) and Abstracts Views on Vision4Press platform.
Data correspond to usage on the plateform after 2015. The current usage metrics is available 48-96 hours after online publication and is updated daily on week days.
Initial download of the metrics may take a while.