Fig. 2
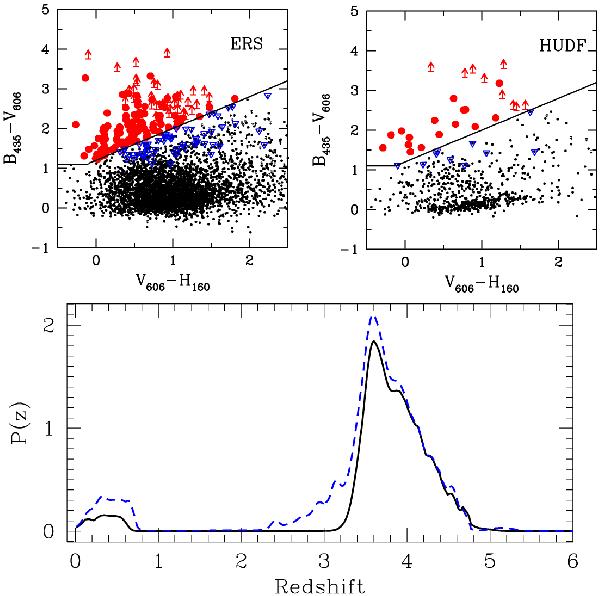
Upper panels: colour–colour diagrams for B-dropouts in the ERS (left) and HUDF (right) fields. Selected objects are marked in red, and the blue points indicate B-dropout candidates in the (B − V) vs. (V − Z) selection window excluded by the present analysis. Lower panel: combined photometric redshift probability distribution of our ERS B-dropout candidates (black line) and of galaxies selected from the (B − V) vs. (V − Z) diagram (blue dashed line): the (V − H) selected objects have a lower probability of having zphot ≲ 3.5 solutions.
Current usage metrics show cumulative count of Article Views (full-text article views including HTML views, PDF and ePub downloads, according to the available data) and Abstracts Views on Vision4Press platform.
Data correspond to usage on the plateform after 2015. The current usage metrics is available 48-96 hours after online publication and is updated daily on week days.
Initial download of the metrics may take a while.