Fig. 3
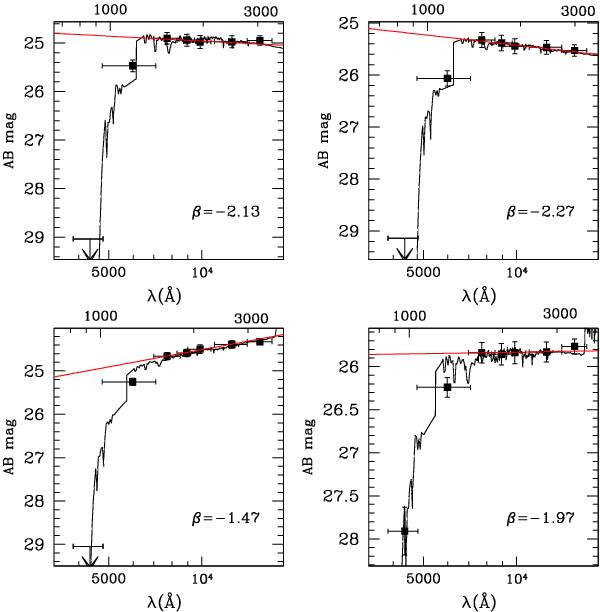
A comparison of the fitted UV slope (red continuous line) and best-fit SED of four objects in our sample having best-fit photometric redshift in the range zphot = 3.5 − 4.1. The observed magnitudes (filled squares and errorbars) are, from left to right: B,V,I,Z,Y,J,H. The linear-fit is performed on I,Z,Y,J. The lower and upper horizontal axes show the observer-frame and the rest-frame wavelengths, respectively.
Current usage metrics show cumulative count of Article Views (full-text article views including HTML views, PDF and ePub downloads, according to the available data) and Abstracts Views on Vision4Press platform.
Data correspond to usage on the plateform after 2015. The current usage metrics is available 48-96 hours after online publication and is updated daily on week days.
Initial download of the metrics may take a while.