Fig. 8
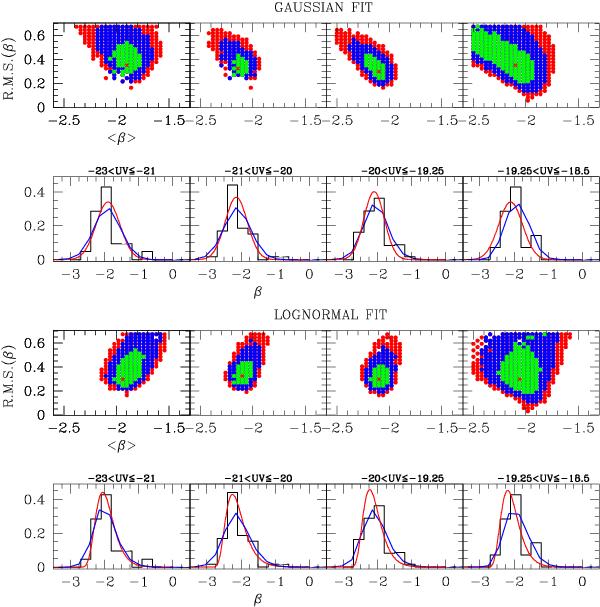
Maximum likelihood contours (68%, 95%, and 99% c.l. in green, blue, and red, respectively) for the Gaussian and lognormal fit at different magnitudes. The histograms are the observed data. The red continuous line in each bin is the relevant best-fit distribution. The blue line show how it appears after being “convolved” by observational effects.
Current usage metrics show cumulative count of Article Views (full-text article views including HTML views, PDF and ePub downloads, according to the available data) and Abstracts Views on Vision4Press platform.
Data correspond to usage on the plateform after 2015. The current usage metrics is available 48-96 hours after online publication and is updated daily on week days.
Initial download of the metrics may take a while.