Fig. 1
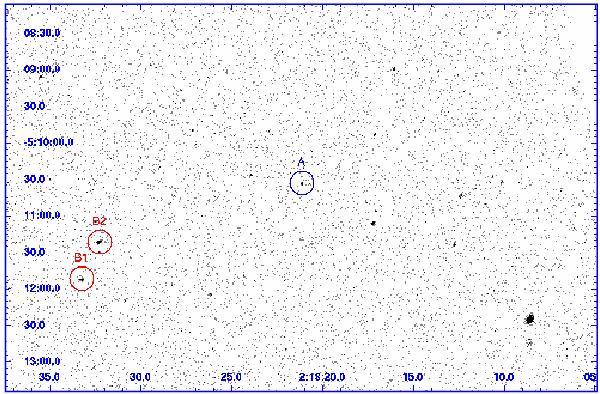
Unbinned Chandra photon-image in the [0.5–2] keV band of cluster IRC-0218A for a total exposure time of ~84 ks. The blue circle indicates the position of the main cluster component (A) as inferred from the Spitzer and XMM data. The two red circles (B1, B2) indicate point sources in the vicinity of a possible second cluster component as proposed by Tanaka et al. (2010).
Current usage metrics show cumulative count of Article Views (full-text article views including HTML views, PDF and ePub downloads, according to the available data) and Abstracts Views on Vision4Press platform.
Data correspond to usage on the plateform after 2015. The current usage metrics is available 48-96 hours after online publication and is updated daily on week days.
Initial download of the metrics may take a while.