Free Access
Fig. 7
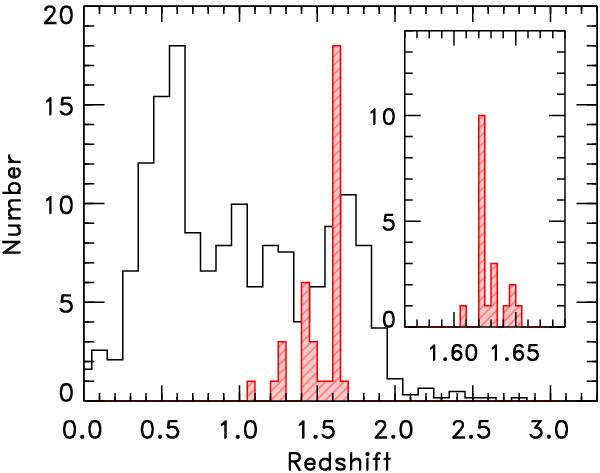
Redshifts available within 2 Mpc of the cluster core; the black and red histograms are for the photometric and spectroscopic redshifts, respectively. The inset panel shows a zoom of the redshift distribution around the cluster where the histogram uses bins of d(z) = 0.005.
Current usage metrics show cumulative count of Article Views (full-text article views including HTML views, PDF and ePub downloads, according to the available data) and Abstracts Views on Vision4Press platform.
Data correspond to usage on the plateform after 2015. The current usage metrics is available 48-96 hours after online publication and is updated daily on week days.
Initial download of the metrics may take a while.