Fig. 8
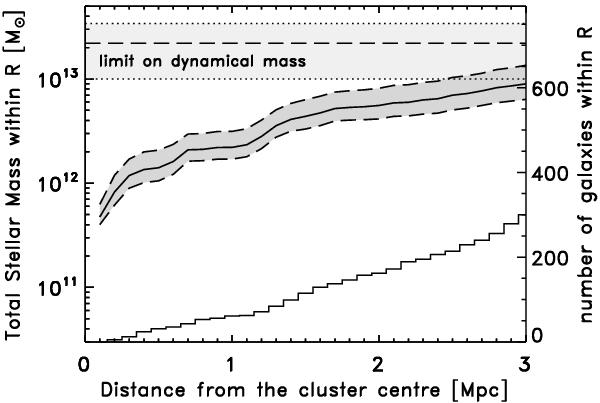
Stellar mass estimate as a function of distance from the center of the putative cluster. The solid curve shows the total stellar mass in all galaxies associated with the cluster (photometric redshifts); the gray region includes the 68% confidence interval on the stellar mass for each galaxy. The histogram shows the total number of galaxies. The light-gray horizontal strip indicates our inferred 1σ range for the dynamical mass.
Current usage metrics show cumulative count of Article Views (full-text article views including HTML views, PDF and ePub downloads, according to the available data) and Abstracts Views on Vision4Press platform.
Data correspond to usage on the plateform after 2015. The current usage metrics is available 48-96 hours after online publication and is updated daily on week days.
Initial download of the metrics may take a while.