Free Access
Fig. 1
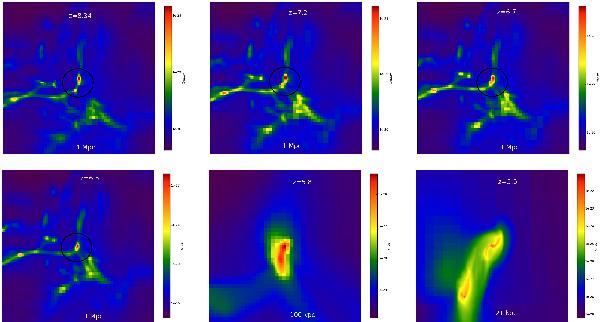
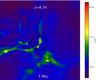
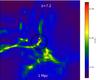
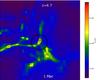
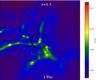
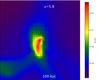
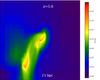
Time sequence of density snapshots at different redshifts. Redshift and distance scales are mentioned in each panel, and shown for model A. The values of density shown in the colorbar are in comoving units [g/cm3]. The merging of clumps is shown inside the black circle.
This figure is made of several images, please see below:
Current usage metrics show cumulative count of Article Views (full-text article views including HTML views, PDF and ePub downloads, according to the available data) and Abstracts Views on Vision4Press platform.
Data correspond to usage on the plateform after 2015. The current usage metrics is available 48-96 hours after online publication and is updated daily on week days.
Initial download of the metrics may take a while.