Fig. 8
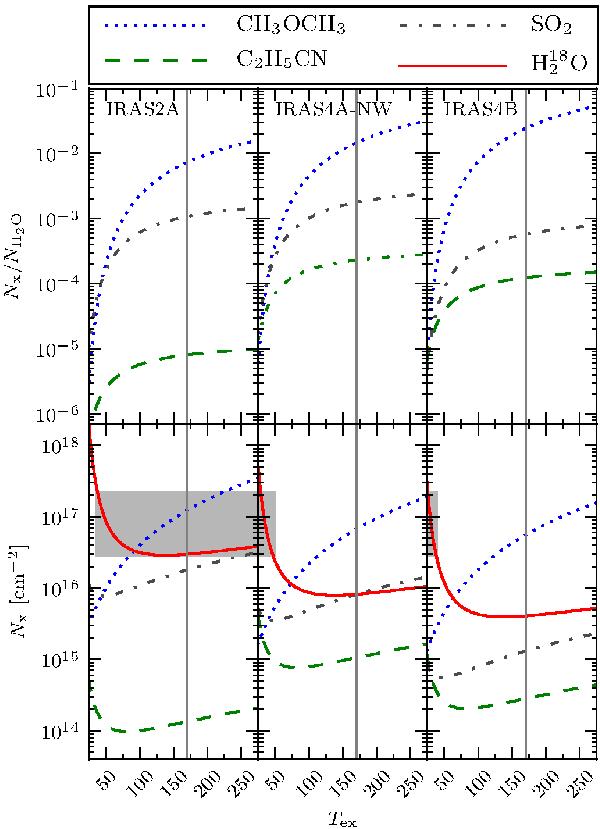
Plots showing (upper) the ratio between the detected molecules and water (H2O), assuming that the species have the same Tex and (lower) the column density of all the detected lines (including H O). The colors and line style indicate the different molecules, the gray vertical line mark Tex = 170 K and the gray area in each plot indicate the temperatures where the column density of HO is the same for the sources.
Current usage metrics show cumulative count of Article Views (full-text article views including HTML views, PDF and ePub downloads, according to the available data) and Abstracts Views on Vision4Press platform.
Data correspond to usage on the plateform after 2015. The current usage metrics is available 48-96 hours after online publication and is updated daily on week days.
Initial download of the metrics may take a while.