Free Access
Fig. 9
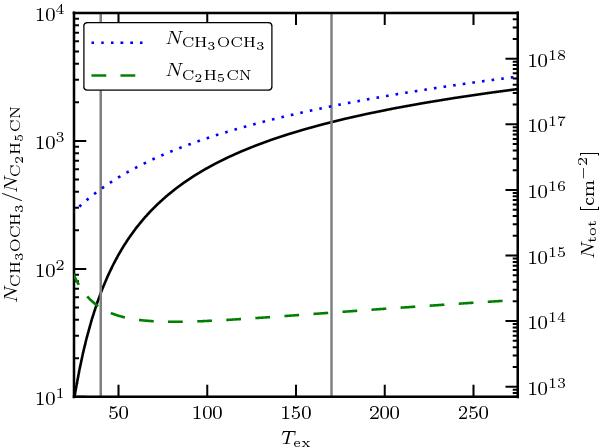
Plot of the ratio between CH3OCH3 and C2H5CN in IRAS2A (left y-axis, filled line), and the column densities derived for those molecules (right y-axis, dashed/dash dotted line) for temperatures between 25 and 275 K. The vertical lines show T = 40 and 170 K.
Current usage metrics show cumulative count of Article Views (full-text article views including HTML views, PDF and ePub downloads, according to the available data) and Abstracts Views on Vision4Press platform.
Data correspond to usage on the plateform after 2015. The current usage metrics is available 48-96 hours after online publication and is updated daily on week days.
Initial download of the metrics may take a while.