Fig. 1
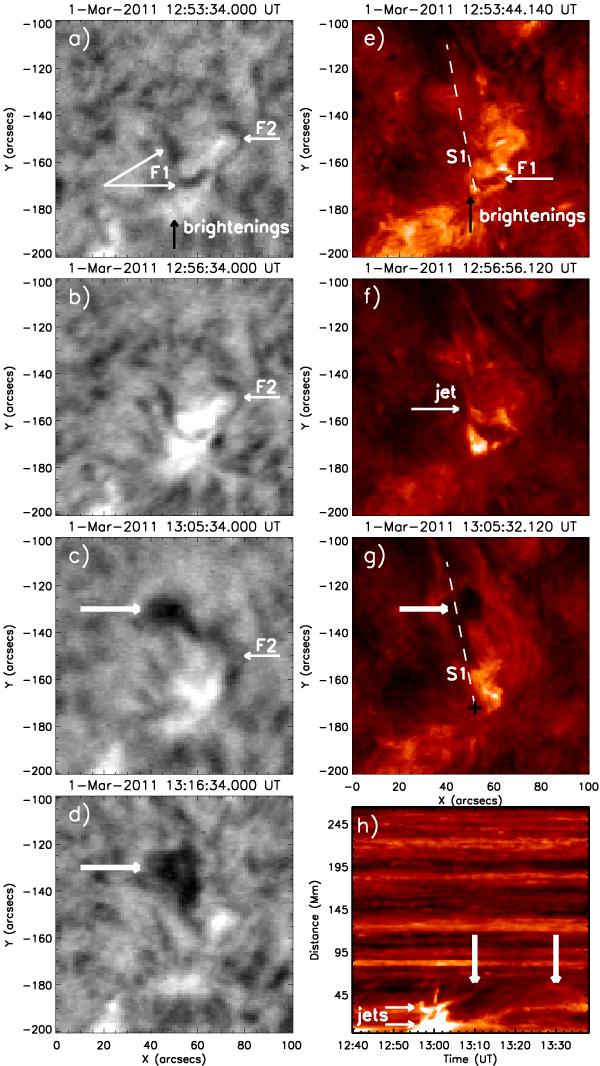
Evolution of the filament before, during, and after the eruption in Hα filtergrams from the GONG/NSO (panels a) − d)) and in AIA 304 images (panels e) − g)). Panel h) is a time-slice image obtained along the sector S1, dashed lines in panels e) and g). F1 and F2 indicate two mini-filaments. The plus shows the eruption center. The thick arrows indicate the falling material of the erupting filament. The temporal evolution in the AIA 304 Å as seen in the panels e) − g) is shown in the movie available in the online edition.
Current usage metrics show cumulative count of Article Views (full-text article views including HTML views, PDF and ePub downloads, according to the available data) and Abstracts Views on Vision4Press platform.
Data correspond to usage on the plateform after 2015. The current usage metrics is available 48-96 hours after online publication and is updated daily on week days.
Initial download of the metrics may take a while.